🌍 LIDAR DSM Tile Server/Generator
This server provides elevation data tiles generated from USGS 3DEP LIDAR data. Tiles are processed using high-pass filtering to highlight terrain features.
Advantages Over Other Tile Sources
| Other Sources | This Project | Comparison |
|---|---|---|
|
USGS DEM
|
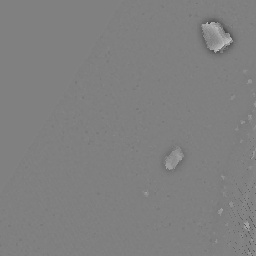
LIDAR min
|
USGS DEM erases buildings and interpolates the missing hole, while this keeps them, for accurate tracing in OSM. |
|
USGS Hillshade
|
LIDAR min
|
USGS Hillshade sometimes hides cliff details in completely black shadows |
|
USGS Hillshade
|
LIDAR min
|
This has higher resolution in some areas (but missing data in others 🤷) |
|
Esri Satellite
|
LIDAR min
|
Satellite imagery of cliffs is often skewed by the angle of the satellite camera and difficult to tell where the cliff is. LIDAR scans from helicopters have ~1 m accuracy. |
|
NY State Hillshade
|
LIDAR min
|
Doesn't filter out things over water. |
Live Map Demo
Try out the LIDAR tiles in this interactive map. Use the controls below to switch between different example locations and grid methods:
Usage
Tile URL Format
https://dwd5050r2ul4y.cloudfront.net/{grid_method}/{zoom}/{x}/{y}.jpgParameters
- grid_method: One of
min,max,stdev,mean,idw, orcount - zoom: Zoom level (currently supports 18-19)
- x, y: Tile coordinates in the slippy map format
Grid Methods
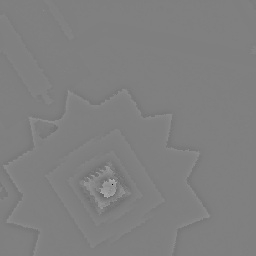
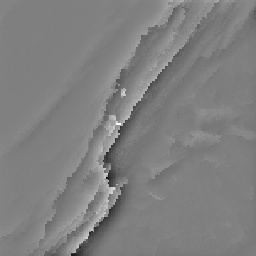
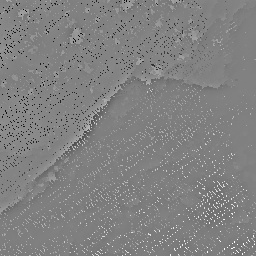
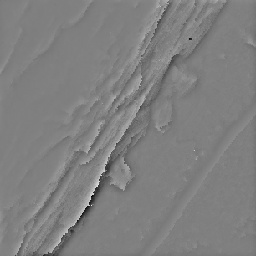
The main focus is on the min method, which reveals ground features hidden by vegetation that aren't visible in the standard hillshade. The other supported methods have some use, too, though:
min: Lowest elevation in each grid cell (ground level or buildings hidden by vegetation)max: Highest elevation in each grid cell (buildings not covered by vegetation)stdev: Elevation standard deviation in each grid cell (vertical features shown as bright lines)mean: Average elevation in each grid cellidw: Inverse Distance Weighted interpolation (similar tomean)count: Number of LIDAR points in each grid cell
Example URLs
https://dwd5050r2ul4y.cloudfront.net/min/18/77030/97566.jpg
https://dwd5050r2ul4y.cloudfront.net/stdev/19/154060/195133.jpg
Integration with Web Maps
This tile server follows the standard slippy map tile format and can be used with:
- Leaflet.js
- OpenLayers
- Mapbox GL JS
- Any other web mapping library that supports XYZ tile layers
OpenStreetMap iD Editor
Click to open iD Editor preconfigured with the given grid method: min, max, stdev, mean, idw, count.
Alternatively, create a Custom Background URL using min grid method with this URL, for instance:
https://dwd5050r2ul4y.cloudfront.net/min/{zoom}/{x}/{y}.jpgOsmAnd
Click here from your phone to automatically install a map with the given grid method: min, max, stdev, mean, idw, count. (Not currently working?)
Alternatively, you can manually create a custom Map Source using min grid method with this URL, for instance:
https://dwd5050r2ul4y.cloudfront.net/min/{0}/{1}/{2}.jpgLeaflet.js Example
L.tileLayer('https://dwd5050r2ul4y.cloudfront.net/idw/{z}/{x}/{y}.jpg', {
    attribution: 'LIDAR Data: USGS 3DEP',
    maxZoom: 19,
    minZoom: 18
}).addTo(map);
OpenLayers Example
new ol.layer.Tile({
    source: new ol.source.XYZ({
        url: 'https://dwd5050r2ul4y.cloudfront.net/idw/{z}/{x}/{y}.jpg',
        attributions: 'LIDAR Data: USGS 3DEP'
    })
})
Data Source
Tiles are generated from USGS 3DEP (3D Elevation Program) LIDAR point cloud data. The data is processed using:
- PDAL for point cloud processing
- Built-in grid methods
- High-pass filtering to enhance building and terrain edges
Technical Details
- Tile Size: 256x256 pixels (standard web mapping format)
- Format: JPG with 95% quality
- Projection: Web Mercator / Pseudo-Mercator (EPSG:3857)
- CORS: Enabled for web applications
- Metadata: JPEG EXIF tags list the LIDAR sources used to generate the tile, its creation date and software version, and elevation range
Support
For questions or issues, please refer to the project documentation or contact the maintainer.